Query Profiler Panel
Starting from version 2.2, Studio Enterprise Edition includes a functionality called Profiling. To understand how Profiling works, please refer to the Profiler page.
In the above section you can choose the server in order to investigate queries executed on it and manage the local cache.
NOTE: This feature is available only in the OrientDB Enterprise Edition. If you are interested in a commercial license look at OrientDB Subscription Packages.
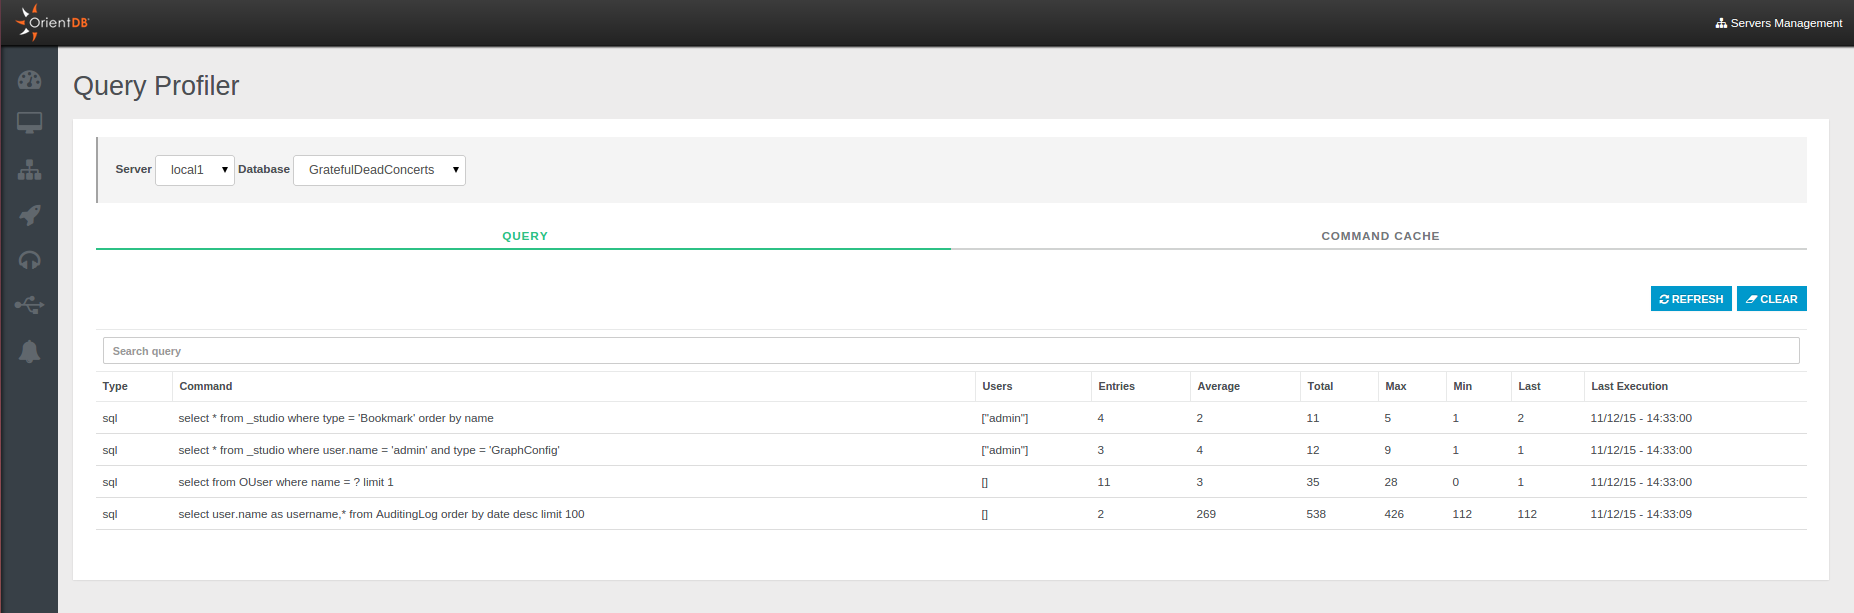
Query
This panel shows all the queries executed on a specific server grouped by the command content. For each query the following information are reported:
Type, as the query typeCommand, as the content of the queryUsers, as the users who executed the queryEntries, as the number of times the query it was executedAverage, as the average required time by the queriesTotal, as the total required time by all the queriesMax, as the maximum required timeMin, as the minimum required timeLast, as the time required by the last queryLast execution, as the timestamp of the last query execution
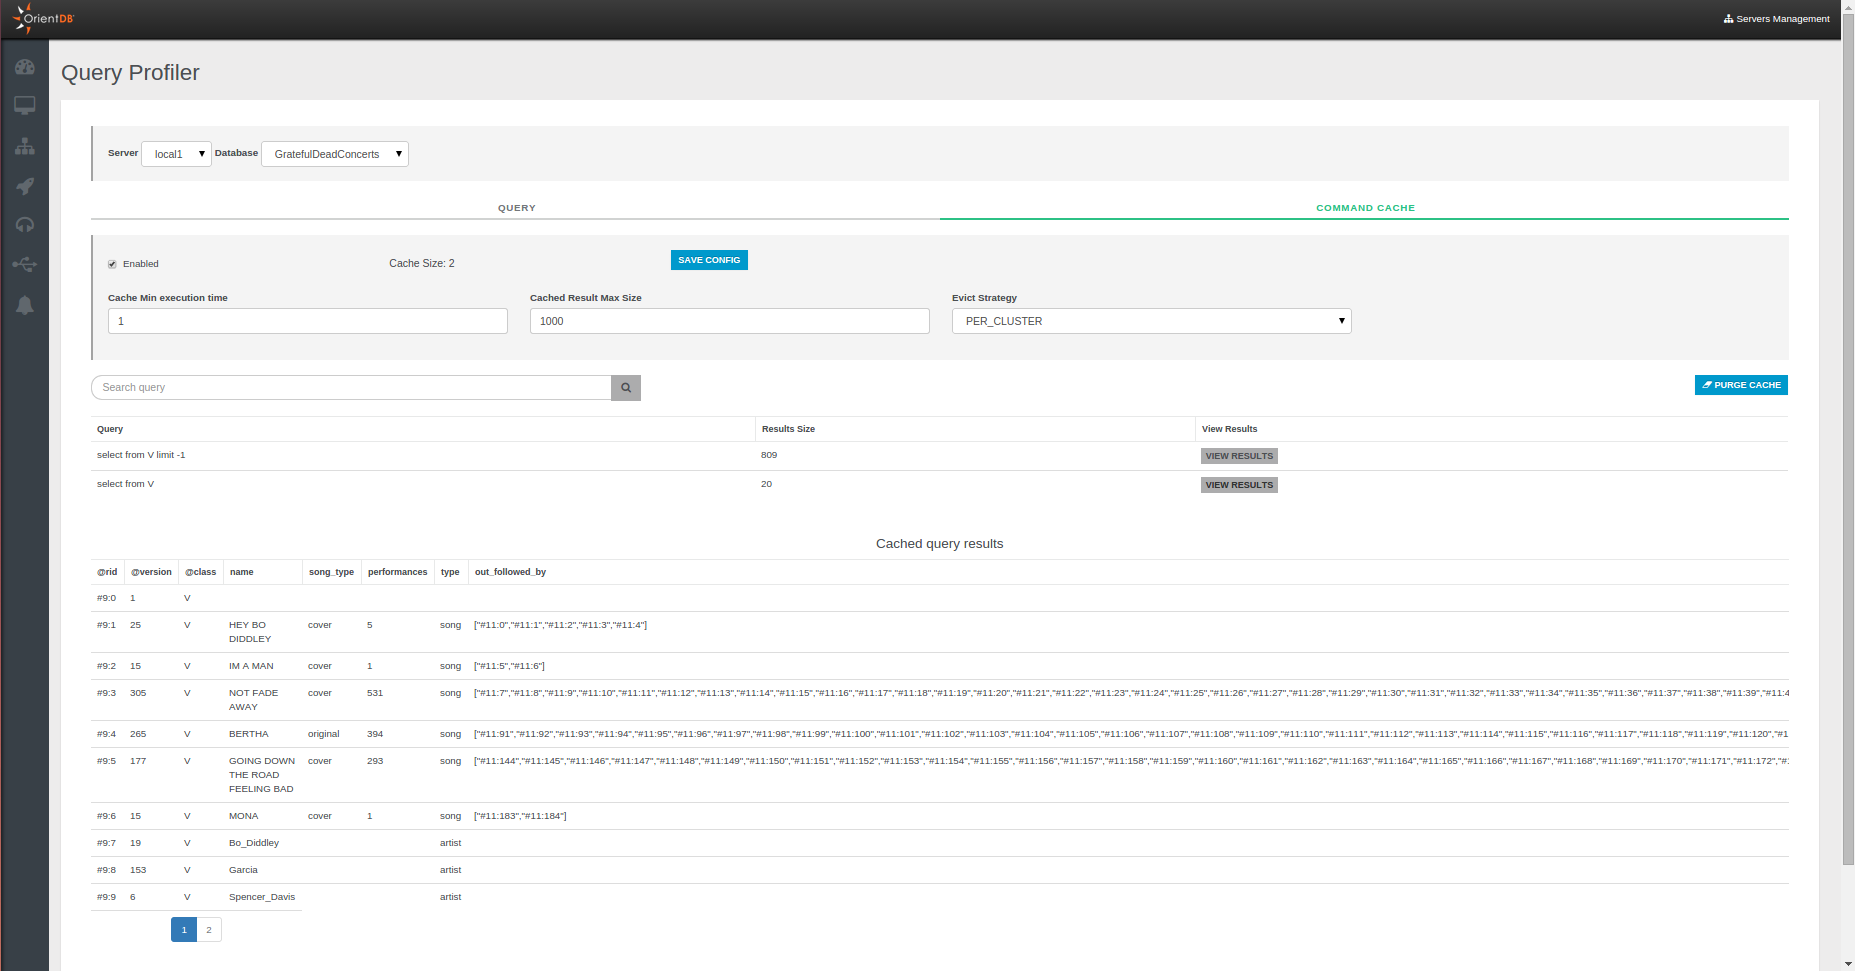
Command Cache
Through this panel you can manage the cache of the specific server and consult the cached results of queries by using the VIEW RESULTS button.
You can even filter the queries by the "Query" field and purge the whole cache by using the PURGE CACHE button.